vis/lineplots/
mg_ternaryplot.pro
Produce a ternary plot.
Examples
Try the main-level example program at the end of this file:
IDL> .run mg_ternaryplot
  d = read_csv(filepath('ternary_data.txt', root=mg_src_root()))
  mg_ternaryplot, d.field2, d.field3, d.field4, psym=!mg.psym.triangle, $
                  color='000000'x, background='ffffff'x, $
                  atitle='aerosol single scattering albedo', $
                  btitle='Angstrom exponent', $
                  ctitle='back-scattering fraction'

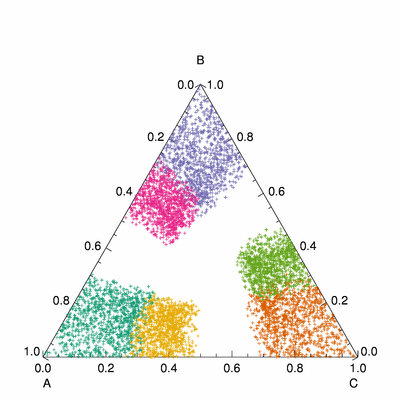
The next example does:
  n = 1000L
  a = randomu(seed, n)
  b = randomu(seed, n)
  c = randomu(seed, n)
  mg_ternaryplot, color='000000'x, background='ffffff'x, /nodata, $
                  atitle='A', btitle='B', ctitle='C'
  mg_ternaryplot, a + 2., b, c, psym=!mg.psym.plussign, symsize=0.5, $
                  color=rgb[0], /overplot
  mg_ternaryplot, a, b + 2., c, psym=!mg.psym.plussign, symsize=0.5, $
                  color=rgb[1], /overplot
  mg_ternaryplot, a, b, c + 2., psym=!mg.psym.plussign, symsize=0.5, $
                  color=rgb[2], /overplot
  mg_ternaryplot, a + 1., b, c + 2., psym=!mg.psym.plussign, $
                  symsize=0.5, color=rgb[3], /overplot
  mg_ternaryplot, a, b + 2., c + 1., psym=!mg.psym.plussign, $
                  symsize=0.5, color=rgb[4], /overplot
  mg_ternaryplot, a + 2., b + 1., c, psym=!mg.psym.plussign, $
                  symsize=0.5, color=rgb[5], /overplot
Routines
top mg_ternaryplot
mg_ternaryplot, a, b, c [, atitle=string] [, btitle=string] [, ctitle=string] [, xmargin=fltarr(2)] [, ymargin=fltarr(2)] [, /overplot] [, /nodata] [, _extra=keywords]
Create a ternary plot.
Parameters
- a in required type=fltarr
closer to lower left indicates higher
avalue- b in required type=fltarr
closer to lower right indicates higher
bvalue- c in required type=fltarr
closer to upper middle indicates higher
cvalue
Keywords
- atitle in optional type=string
title for
avalues- btitle in optional type=string
title for
bvalues- ctitle in optional type=string
title for
cvalues- xmargin in optional type=fltarr(2)
x-margins for plot in units of characters
- ymargin in optional type=fltarr(2)
y-margins for plot in units of characters
- overplot in optional type=boolean
set to overplot on a previously setup coordinate system
- nodata in optional type=boolean
set to create a coordinate system without plotting any data
- _extra in optional type=keywords
File attributes
| Modification date: | Wed May 14 15:07:15 2014 |
| Lines: | 103 |
| Docformat: | rst rst |
Contact me if you have enhancement requests or bug fixes.