flow/
vis_vel.pro
direct graphics, flow
includes main-level programMake streamline plots of 2D vector fields.
Examples
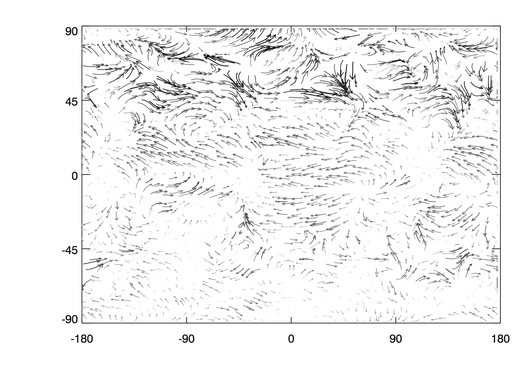
See the main-level program part of this file for the details of creating the below visualizations. To use a list of random starting points use something like:
  IDL> restore, filepath('globalwinds.dat', subdir=['examples','data'])
  IDL> vis_vel, u, v, nvecs=800

To use a grid of slightly jittered starting points use something like:
IDL> vis_vel, u, v, /grid, stride=3, jitter=0.5
Routines
result = vis_vel_interpolate(a, x, y)Bilinear interpolation.
vis_vel_arrowhead, sAdd the heads to the arrows.
result = vis_vel_streamlines(u, v, nvecs=long, length=fltarr, nsteps=long [, /grid] [, stride=long] [, jitter=float])Compute the streamlines from each starting point.
vis_vel, u, v [, x] [, y] [, /overplot] [, nvecs=long] [, length=float] [, nsteps=long] [, xmax=float] [, /grid] [, stride=long] [, jitter=float] [, thick=float] [, max_thick=float] [, color=color] [, axes_color=color] [, streamlines=fltarr] [, _extra=keywords]Draw a velocity (flow) field with streamlines following the field proportional in length to the vector field magnitude.
Routine details
top vis_vel_interpolate
result = vis_vel_interpolate(a, x, y)
Bilinear interpolation.
Return value
fltarr(m * n)
Parameters
- a in required type=fltarr(m, n)
vector
- x in required type=fltarr(m * n)
x coords
- y in required type=fltarr(m * n)
y coords
top vis_vel_arrowhead
vis_vel_arrowhead, s
Add the heads to the arrows.
Parameters
- s in out required type=fltarr
array of streamlines
top vis_vel_streamlines
result = vis_vel_streamlines(u, v, nvecs=long, length=fltarr, nsteps=long [, /grid] [, stride=long] [, jitter=float])
Compute the streamlines from each starting point.
Return value
fltarr(mvecs, nsteps + 3, 2)
Parameters
- u in required type=fltarr(m, n)
x component at each point of the vector field; must be a 2D array
- v in required type=fltarr(m, n)
y component at each point of the vector field; must be a 2D array
Keywords
- nvecs in out required type=long
number of steps in the streamline
- length in required type=fltarr
scaling factor for the length of the streamlines
- nsteps in required type=long
number of steps in each streamline
- grid in optional type=boolean
set to jitter a regular grid of starting points instead of choosing completely random starting points
- stride in optional type=long default=1L
stride amount through grid; only used if GRID is set
- jitter in optional type=float default=0.5
amount to jitter elements in the grid; as a fraction of the distance between grid elements
top vis_vel
vis_vel, u, v [, x] [, y] [, /overplot] [, nvecs=long] [, length=float] [, nsteps=long] [, xmax=float] [, /grid] [, stride=long] [, jitter=float] [, thick=float] [, max_thick=float] [, color=color] [, axes_color=color] [, streamlines=fltarr] [, _extra=keywords]
Draw a velocity (flow) field with streamlines following the field proportional in length to the vector field magnitude.
A random number of starting points can be picked (with NVECS=n) or a grid of starting points jittered slightly to eliminate linear patterns (with /GRID, STRIDE=3, and JITTER=jit).
NVECS random points within the (u,v) arrays are selected. For each "shot" the field (as bilinearly interpolated) at each point is followed using a vector of LENGTH length, tracing a line with NSTEPS segments. An arrow head is drawn at the end.
Parameters
- u in required type=fltarr(m, n)
x component at each point of the vector field; must be a 2D array
- v in required type=fltarr(m, n)
y component at each point of the vector field; must be a 2D array
- x in optional type=fltarr(m)
x axis values
- y in optional type=fltarr(n)
y axis values
Keywords
- overplot in optional type=boolean
set to not erase current display before making plot
- nvecs in optional type=long default=200L
number of vectors (arrows) to draw
- length in optional type=float default=0.1
the length of each arrow line segment expressed as a fraction of the longest vector divided by the number of steps
- nsteps in optional type=long default=10L
number of shoots or line segments for each arrow
- xmax in optional type=float default=1.0
ignored; only present to implement the interface of VEL
- grid in optional type=boolean
set to jitter a regular grid of starting points instead of choosing completely random starting points
- stride in optional type=long default=1L
stride amount through grid; only used if GRID is set
- jitter in optional type=float default=0.5
amount to jitter elements in the grid; as a fraction of the distance between grid elements
- thick in optional type=float default=1.0
set to a constant to use that thickness for streamlines instead of thicknesses set to values proportional to the magnitude of the vector field at the point of the beginning of the streamline
- max_thick in optional type=float default=3.0
maximum thickness to use for streamlines; ignored if THICK keyword is present
- color in optional type=color
color of streamlines
- axes_color in optional type=color
color of axes
- streamlines out optional type=fltarr
calculated streamlines; no graphics output is done if a named variable is passed to this keyword
- _extra in optional type=keywords
keywords to PLOT and PLOTS routines that plot the streamlines
File attributes
| Modification date: | Mon Nov 29 18:32:42 2010 |
| Lines: | 408 |
| Docformat: | rst rst |