googlechart/
vis_gc_piechart.pro
includes main-level programtop vis_gc_piechart
result = vis_gc_piechart(slices [, dimensions=lonarr] [, /threed] [, title=string or strarr] [, label=strarr] [, color=lonarr] [, url=string])
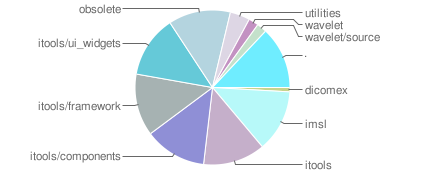
Create an image of a pie chart using the Google Charts API.
Return value
bytarr(3, xsize, ysize)
Parameters
- slices in required type=fltarr
vector of values of slices
Keywords
- dimensions in optional type=lonarr default=[200, 100]
size of output image
- threed in optional type=boolean
set to create a 3D pie chart; default is a 2D pie chart
- title in optional type=string or strarr
title of the chart
- label in optional type=strarr
labels for pie slices
- color in optional type=lonarr
colors of the slices
- url out optional type=string
URL used by Google Charts API
Examples
Running the main-level example at the end of this file:
IDL> .run vis_gc_piechart
Other attributes
- Requires:
IDL 6.4
File attributes
| Modification date: | Mon Nov 29 18:32:39 2010 |
| Lines: | 82 |
| Docformat: | rst rst |