lineplots/
vis_datavase.pro
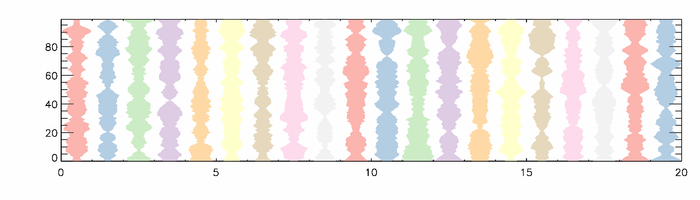
includes main-level programBased on the paper "Data Vases: Plots for Visualizing Multiple Time Series" by Sidharth Thakur and Theresa-Marie Rhyne.
Examples
Try the main-level example program at the end of this file:
IDL> .run vis_datavase
File attributes
| Modification date: | Mon Nov 29 18:32:44 2010 |
| Lines: | 99 |
| Docformat: | rst rst |