lineplots/
vis_horizon.pro
direct graphics
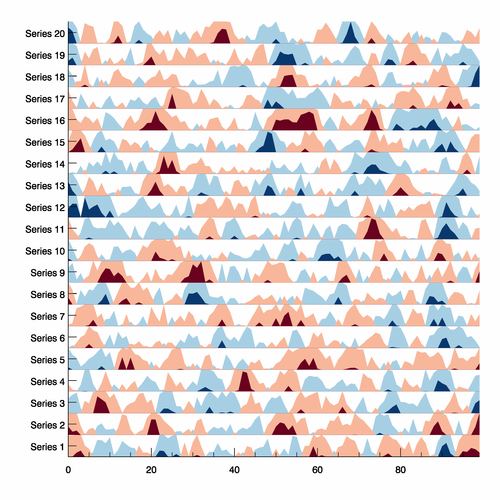
includes main-level programHorizons graph squeeze many line plots into a single graph by folding the graph into bands and color coding them. The reduced vertical space allows for more datasets to be compared and anomolies to be spotted more quickly. They are based on the following description:
http://www.panopticon.com/products/horizon.htm
top vis_horizon
vis_horizon, x, data [, titles=strarr(nseries)] [, nbands=long] [, minimum=numeric] [, maximum=numeric] [, ystyle=bitmask] [, colors=bytarr(nbands)] [, _extra=keywords]
Plot a horizon graph.
Parameters
- x in required type=fltarr(npoints)
x-values for all the datasets
- data in required type=fltarr(nseries, npoints)
datasets
Keywords
- titles in optional type=strarr(nseries)
y-axis titles for series
- nbands in optional type=long default=6
number of bands to break data into, must be even
- minimum in optional type=numeric default=min(data)
minimum value to use when dividing range into bands
- maximum in optional type=numeric default=max(data)
maximum value to use when dividing range into bands
- ystyle in optional type=bitmask
YSTYLE keyword to PLOT (YSTYLE=1 is automatically used)
- colors in optional type=bytarr(nbands)
colors to use
- _extra in optional type=keywords
keywords to PLOT
File attributes
| Modification date: | Mon Nov 29 18:32:44 2010 |
| Lines: | 184 |
| Docformat: | rst rst |