lineplots/
vis_stepchart.pro
direct graphics
includes main-level programPlot a stepchart i.e. time series data were the current value changes at a particular time not gradually over time (see example below).
Examples
Main-level program is at the end of this file:
IDL> .run vis_stepchart
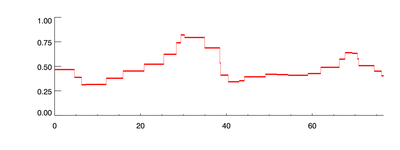
If the RISER_THICK is set to 0.0, no risers are shown:

Other file information
- Todo:
* need to set baseline instead of assuming it is zero
Routines
vis_stepchart_plotflats, x, y [, thick=fltarr] [, /fill] [, color=color] [, _extra=keywords]Plot the flat portions of a graph on a predefined coordinate system.
vis_stepchart, x [, y] [, /overplot] [, thick=float] [, riser_thick=float] [, /fill] [, color=color] [, axis_color=color] [, _extra=keywords]Plot the stepchart.
Routine details
top vis_stepchart_plotflats
vis_stepchart_plotflats, x, y [, thick=fltarr] [, /fill] [, color=color] [, _extra=keywords]
Plot the flat portions of a graph on a predefined coordinate system.
Parameters
- x in required type=fltarr(n)
x-coordinates of expanded data
- y in required type=fltarr(n)
y-coordinates of expanded data
Keywords
- thick in optional type=fltarr
thicknes of flat portions of the graph
- fill in optional type=boolean
set to fill under the plot
- color in optional type=color
color of steps
- _extra in optional type=keywords
keywords to PLOTS
top vis_stepchart
vis_stepchart, x [, y] [, /overplot] [, thick=float] [, riser_thick=float] [, /fill] [, color=color] [, axis_color=color] [, _extra=keywords]
Plot the stepchart.
Parameters
- x in required type=fltarr(n)
x-coordinates if both x and y are passed; y-coordinates if only x is passed
- y in optional type=fltarr(n)
y-coordinates
Keywords
- overplot in optional type=boolean
set to overplot
- thick in optional type=float default=1.0
thickness of lines
- riser_thick in optional type=float default=0.5 * thick
thickness of "riser" line segments; set to 0.0 to not show risers
- fill in optional type=boolean
set to fill under the plot
- color in optional type=color
color of steps
- axis_color in optional type=color
color of axis, defaults to color of steps
- _extra in optional type=keywords
keywords to PLOT, OPLOT, or PLOTS
File attributes
| Modification date: | Mon Nov 29 18:32:44 2010 |
| Lines: | 164 |
| Docformat: | rst rst |